Data can be a scary word. The data waters are often dark, deep, and unknown for most companies. But, if you are looking for ways to take your business and marketing strategy to the next level, you must dive into the unknown water. Luckily, you’ll have some assistance, as Google Analytics acts as your personal flotation device.

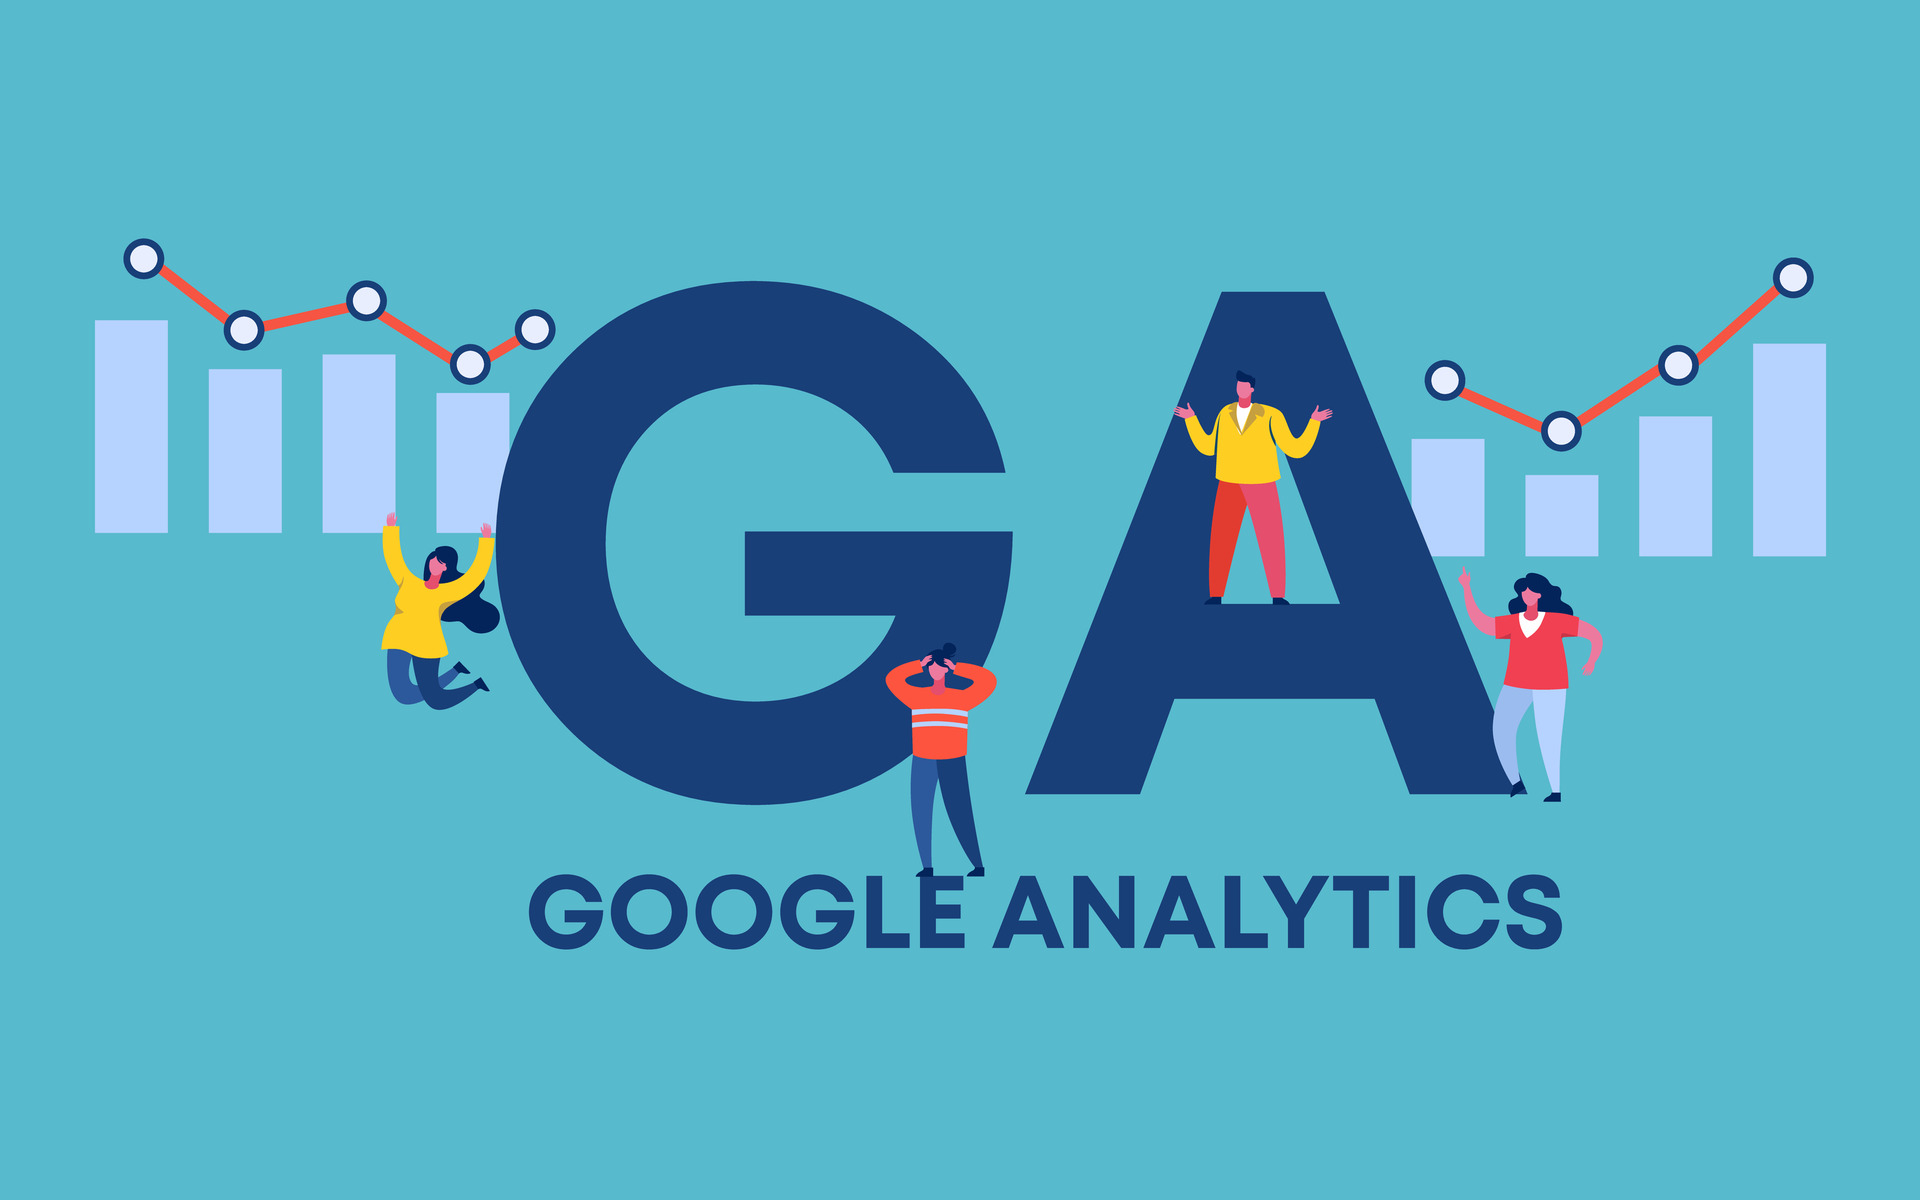
What is Google Analytics?
Google Analytics (GA) is a free tool, powered by Google, that allows you to track the activity on your website on a deeper level. Not only can you see the volume of traffic on your site, but you can track the content users interact with, how users get to your site, how much time a user spends on a page, and much more. Proper use of this tool is vital in improving the efficiency and effectiveness of your marketing.
If you do not already have Google Analytics set up for your company, get it set up ASAP. If you need help setting up your Google Analytics account and getting acclimated to the layout, watch this tutorial video.
Why does Tracking my Site Visitors Matter?
Ok, so you may be thinking to yourself, “Sure this stuff sounds pretty useful, but does monitoring how people use my website really matter?”. The answer is a resounding yes. Let me break it down for you.
Your boss asks you for a report comparing the performance of your various social media efforts.
Sure, you could just compare engagement numbers across Facebook, Instagram, and LinkedIn. Or even compare follower growth across the various channels.
But, what if you wanted to go above and beyond. What if you could show your boss which social posts were most successful at drawing people to your website. And once those people got to the website it resulted in X amount of sales and Y amount of new clients.
Understand the importance now?
Not only does Google Analytics allow you to understand user behavior across the website but it allows you to better evaluate marketing performance. Google Analytics shows you what is actually working versus what is not. Which, in turn, allows you to be more effective with your marketing, draw in more customers, increase your conversions, and ultimately make more money.
Understand your Customer Journey
Before we dive into the water and explore Google Analytics, it is crucial to understand your company’s customer creation funnel. Clearly, your neighbor’s roofing business has a different business model than Amazon. However, the three main stages of the customer funnel are consistent across all companies. The three stages are Awareness, Consideration, and Conversion.
The top of the funnel, or the Awareness stage, refers to customers becoming aware of your brand. This may be users coming to your website for the first time, or seeing a post on social media, or even a google ad.
The middle stage of the funnel, the Consideration stage, focuses on users coming back to your website. Think of an individual buying a car. They are likely browsing many different websites, comparing models, looking at prices, reading reviews, and then coming back to your page.
The final stage of the customer creation funnel is Conversion. In this stage, your company successfully converts users into customers. Whether you are a B2B company and this conversion results in a new client, or you are an ecommerce brand and a conversion to you means a product sold, everybody wants to increase their conversions and make more money.
Understand your company’s funnel. In Google Analytics you’ll be able to drill down in each stage of the funnel and analyze key metrics that will help optimize your business.
Top of Funnel Metrics
Now that your toes are wet, let’s dive a little deeper and examine the top of your funnel. As mentioned above, the top of the funnel is all about getting consumers aware of your brand.
The key metrics at the Top of Funnel (and how to find them in GA)
- New site visitors (Audience → Overview → Add Segment → New Users)
- % of new visitors (New users / Total users)
- New direct visitors (Acquisition → All Traffic → Channels → Look at the number of new users in the “Direct” row)
- New users by channel (Acquisition → All Traffic → Channels → Look at the number of new users for each channel)
It is a great habit to track these metrics each week. By tracking these statistics, you will get a better understanding of how your site traffic is performing on a weekly basis, as you roll out new campaigns and initiatives. If you want to learn more about which key metrics your business should focus on, check out this blog on KPIs (Key Performance Indicators).
How will this help my business?
Ok, let’s say you sell cars. The past few weeks you have been rolling out a new paid ad campaign on Google, advertising a seasonal discount on Toyota Highlanders. Your boss asks you, “Can you update me on how the campaign is doing?”.
Well, of course you can. Using Google Analytics you can compare new traffic to the website over the past few weeks to the average traffic before the campaign was implemented. Additionally, in GA you can drill down even further and examine new users from the “paid search” channel to get the exact number of people coming to your site from the paid ads you are running.
At the end of the day, this is the main advantage of Google Analytics. It gives you access to more precise data, which allows you to better evaluate marketing performance.
Middle of Funnel Metrics
Once a consumer is aware of your brand, you want to eventually turn that person into a loyal customer. In the middle of the funnel, or the consideration stage, the main objective is to drive visitors back to your website. A combination of social media efforts, email marketing, and paid advertisements will be necessary to successfully keep consumers sliding down your funnel.
Some key metrics in this stage of the funnel include:
- Visitor Recency (How long does it take for site visitors to return to your website.)
- Banner Click % (Are people clicking on the contact forms on your site?)
- Leads Generated
- Returning Direct Visitor Count (Returning visitors who directly look up your website.)
Importance of Social Media
A key aspect of the middle of the funnel is maintaining a strong social media presence. Social media is a fantastic tool to build loyalty with your clients and to continue to drive visitors to your website. In this day and age, influencer marketing has been hugely successful in reaching desired audiences and is a great way to build relationships with clients. Check out this blog on influencer marketing to learn more.
As you continue to develop content for your various social channels, it is important to occasionally take a step back and evaluate your social performance.
A good practice is to take note each month of your social media followers on each platform, the number of shares your content is generating, and the number of comments. These statistics will help give you a better idea if your social audience is growing and how people are engaging with your content.
Show me an example
Let’s go back to our Toyota Highlander example. A car is a big purchase, so people often take their time and really weigh their options when buying. In the previous example you used a Google Ads campaign to target potential customers in hopes of drawing them to your site. You generated some awareness for your product and even got a few social media followers from the campaign.
Now it is important to keep engaging with those consumers in hopes of driving them to a conversion. One strategy may be to use your social media platform to post videos of client reviews talking about their great experience with your dealership. Consumers love hearing about other people’s experiences and promoting customer reviews is a great way to further inform potential buyers about your services.
Then, in Google Analytics, you can track the performance of these social efforts by seeing if that specific social post generated any traffic to your website. Specifically looking for any returning visitors.
Again, reemphasizing that the main goal in the middle of the funnel is to drive visitors back to your site.
Bottom of Funnel Metrics
Lastly, we have the bottom of the funnel. This is where all your marketing efforts come to fruition. The primary objective in this stage is to generate conversions. This includes transforming leads into buyers and maximizing funnel performance.
Some key metrics to monitor in the bottom of the funnel:
- Number of Goods Sold
- Average Order Value
- Revenue per Visitor
- Days to Conversion
Pay Attention to your Point of Sale Data
Whether your website uses contact forms or shopping carts to track conversions, it is important to monitor customer behavior during the conversion process.
One important metric to look at in Google Analytics is the exit rate from these pages. The exit rate shows the percentage of users who get to a certain page and then exit your site. If you notice a high exit rate on your contact form or shopping cart page that is something worth investigating, as it shows many people are not completing the conversion process.
Take Some Time to Get Used to Google Analytics
Google Analytics is a powerful tool that will help you better evaluate marketing performance. However, it can also be a tricky tool and takes time to get used to. Dip your toes in, the water is warm and full of interesting data to help your business.

- Social Media Nightmares
- Chasing A Branded BBQ Legend
- So You’re Telling Me There’s A Chance!
- What the Influencers Said
- How to Delight Your Customers